EQT

Strategy
Climate Change
Strategy

Topic Highlights

Our belief that natural gas has the potential to drive the transition to a lower-carbon future influences our corporate climate change strategy, which is divided into three segments:

  • Evolve focuses on realizing the unlimited potential of our company — to distinguish our capabilities from those of our peers.
  • Growth allows us to have a broader impact by extending our approach to a greater set of assets.
  • New Ventures lays the foundation to accelerate on the path to a lower-carbon future through partnerships and acquisitions.

In 2023, we:

  • Reduced the Production segment Scope 1 and Scope 2 greenhouse gas (GHG) emissions from the assets acquired from Alta Resources by approximately 65% since we acquired and began to operate them less than 3 years ago.
  • Partnered with Context Labs to support the commercialization of verified, lower-carbon intensity natural gas products and carbon credits.
  • Became the only independent, domestic operator to sign onto the Oil and Gas Decarbonization Charter (OGDC), which calls for the industry to achieve net zero before or by 2050, end routine flaring by 2030, and near-zero upstream methane emissions.

Natural Gas and a Lower-Carbon Future

3-3
Management of material topic
11.2.4
Describe the organization’s approach to public policy development and lobbying on climate change
SASB EM-EP-420a.4
Discussion of how price and demand for hydrocarbons or climate regulation influence the capital expenditure strategy for exploration, acquisition and development of assets
3-3
11.2.4
SASB EM-EP-420a.4

We recognize that climate change is a preeminent sustainability issue that impacts all industries, and particularly the natural gas sector. Furthermore, the makeup of the future energy mix has significant environmental, social, and economic ramifications and will influence the future demand for — and price of — natural gas. We are committed to staying informed on climate science to understand both how climate change affects our business and how we impact climate change.

Both the impacts of climate change and the prevailing views on how to optimally curb the impacts of climate change can meaningfully impact our ability to operate. Increased frequency and severity of adverse weather events, such as storms, floods, droughts, and other extreme climatic events, could cause physical damage to our assets; temporarily or permanently displace our employees and service providers; affect the availability of water necessary for our drilling and completions operations; and otherwise impact our ability to operate on schedule. In addition, the impacts of climate change also have the potential to affect us financially. Changes to federal, state, and local climate-focused laws and regulations could prohibit, inhibit, or increase the costs for us to drill for, produce, and transport natural gas. Change in consumer tastes and continued focus on climate change management and mitigation could result in decreased demand for natural gas and thereby reduce the price we receive for our product. Furthermore, our access to capital funds could be restricted if we are unable to articulate and execute our climate change strategy. Please see Risk Management for more information.

Natural gas is readily available, affordable, reliable, and clean — and represents a critical component of the domestic and global energy supply mix. In the United States, the shale revolution[1] has unlocked an abundant supply of low-cost natural gas. The benefits of the revolution have been meaningful, both to spur the domestic economy and to reduce costs of power and heating for consumers. One of the most meaningful benefits, however, has been the impact on carbon emissions. From 2010 to 2022, the United States decreased its carbon emissions by nearly 800 million metric tons (MT).[2] The leading contributor to reduction of the carbon intensity of emissions in the United States has been the switch in energy production from coal to gas. 

From 2005–2020 Natural Gas Replaced > 200 Coal Plants
 

Map of U.S. showing the movement of natural gas from gas shales, primarily from the Eastern  to Western U.S., compared to retired coal plants as a result of natural gas switching. The number of retired coal plants is heavily weighted in the Eastern U.S.

U.S. CO2 Emissions Reduction by Solution[3]
Coal-to-Gas Switching61%
Wind31%
Solar8%
CO2 Emissions Change by Country: 2010 vs 2022 (MT CO2)[4]
Country  2010  2022  Change in CO2 Emissions
United States 5,456  4,697 -759
European Union 3,311 2,662 -649
Japan 1,201 1,062 -139
Brazil 411 452 41
Russia  1,688 1,856 168
India 1,685  2,627 942
China 8,799 12,135 3,336

During this same period, the United States transitioned from a net importer to a net global exporter of natural gas.[5] The export of natural gas by the United States is critically important to address climate change. The United States is one of a handful of countries in the world with abundant, economically recoverable natural gas. In the absence of affordable, reliable natural gas, countries will turn to coal — a fact made evident in the wake of western sanctions on Russia and the 2022 sabotage of the Nord Stream pipeline.

Global consumption of coal climbed to a new all-time high in 2022, and there is no realistic option to achieve a 1.5-degree scenario — absent a rapid, significant reversal of this trend.[6] The global community recognizes this hurdle with the first-ever Global Stocktake, which was presented at The 28th United Nations Climate Change Conference (COP28) to outline collective action against climate change and which called for “accelerating efforts toward the phase-down of unabated coal power” (emphasis added). To achieve this phase-down, the Global Stocktake calls on a tripling of renewables by 2030, and an acceleration of nuclear and carbon capture, utilization, and storage (CCUS), and recognizes that “transitional fuels” — a politically palatable pseudonym for natural gas — “can play a role in facilitating the energy transition while ensuring energy security.” This explicit call demonstrates the intention for unabated coal to be viewed as separate from, rather than a peer to, transition fuels such as natural gas. Further, the Global Stocktake contemplates that we need more renewables, more nuclear, more natural gas and more CCUS to even get on the path to a 1.5-degree goal.

A 2022 study[7] by EPRI and GTI Energy modeled strategies to achieve economy-wide, net-zero emissions in the United States by 2050. The study assessed three scenarios: (i) an “all options” scenario, in which low-cost natural gas and CCUS were available; (ii) a “higher fuel cost” scenario, in which natural gas and CCUS were available but more costly; and (iii) a “limited options” scenario in which CCUS was not available and, as a result, natural gas consumption was required to decline materially. 

While all three scenarios achieved the desired goal of a net-zero economy, the “limited options” pathway resulted in an incremental annual cost per household of approximately $9,000 as compared to the “all options” scenario. To put this into context, an incremental annual cost of $9,000 per household would have the impact of putting nearly 10% of United States citizens into poverty.[8]

Outside our borders, the global per capita gross domestic product (GDP) is approximately $12,000, and the per capita GDPs of China and India are approximately $12,720 and $2,410, respectively.[9] If we take the costs projected for achieving a net-zero economy in the United States under the three scenario types as similar abroad, it follows that an affordable, sustainable global transition must rely heavily on low-cost natural gas. 

Natural gas is subject to some of the most rigorous regulatory standards for gas production globally. The export of natural gas produced in the United States enables the global expansion of benefits associated with rigorous regulatory standards for production and effectively establishes thresholds for employee safety standards, human rights, emissions, and biodiversity. These benefits, along with the low cost of production and relatively low environmental impact of operators, serve to justify and command a greater market share of the global energy supply mix to increase the influence of the United States on achieving global climate goals.

Furthermore, we believe natural gas will continue to play a key role in the impact of energy on social equity locally, nationally, and internationally. Our operations are concentrated in mostly rural areas of Pennsylvania, Ohio, and West Virginia — areas historically characterized as lower socioeconomic regions. Responsible development of natural gas has led to an infusion of a significant amount of capital in our operating areas, both to landowners and the broader communities, and has served as an engine to improve the quality of life in these regions; please see Economic and Societal Impact for more information. Our operations can positively affect disadvantaged socioeconomic groups in the United States with low-cost clean energy, job opportunities, tax revenue generation, and royalty payments to landowners.

Vision for EQT in the Energy Transition

SASB EM-EP-420a.1
Sensitivity of hydrocarbon reserve levels to future price projection scenarios that account for a price on carbon emissions
TCFD: Strategy – a, b
Disclose the actual and potential impacts of climate-related risks and opportunities on the organization’s businesses, strategy and financial planning.
SASB EM-EP-420a.1
TCFD: Strategy – a, b

Our belief in the role of natural gas in the transition to a lower-carbon future influences our corporate strategy. Our corporate strategy is divided into three segments: Evolve, Growth, and New Ventures. The execution of these strategic segments is not necessarily sequential; rather, each builds upon and supports the others.


Evolve focuses on realizing the full potential of the assets under our control. This evolution started in mid‑2019, has progressed rapidly, and can be measured by our financial and operational performance to date. At its core, the purpose of Evolve is to distinguish our capabilities from those of our peers as we pursue our next strategic path.

One aspect of differentiation has been the adoption of our combo-development operational strategy — providing high confidence, predictability, and improved well and emissions performance. Since 2018, we have reduced the Scope 1 greenhouse emissions from our historical Production segment assets by approximately 68%, in large part due to efficiencies we gained through our combo-development strategy. Please read more about combo-development here.

Additionally, our differentiation can be seen in the emissions reduction targets that we have established for our company. For more information on our emissions targets, see Operational GHG Emissions.

Our evolution is foundational and starts with who we are and how we operate. We invest in technological innovation and our workforce, which allows us to take insight into action. We utilize high-quality data to track financial, operational, and emissions data, which allows us to target high return on investment opportunities.

We believe our team, and the scalability of our platform, will allow us to reap benefits across a broader set of operations.


Growth generates value by applying our evolved approach to a broader set of assets, allowing the acceleration of emissions reduction efforts within the natural gas space. Growth means strategic control over a greater number of absolute emissions in the short-term based on our belief that we can have a greater impact on the pace of emissions reductions in the medium- and long-terms. This is best evidenced by our 2021 acquisition of the Alta Assets and the subsequent reduction in emissions we have been able to achieve. In a matter of less than 3 years of ownership and operation of the Alta Assets, we have reduced the Production segment Scope 1 and Scope 2 GHG emissions from such assets by approximately 65%, and we have reduced the Scope 1 GHG emissions intensity of such assets by 59%. While our company-wide emissions profile initially increased when we acquired the Alta Assets, we have been able to scale our emissions reduction initiatives, such as our electric frac fleets and pneumatic device replacement program, to significantly reduce the emissions from these assets at a pace that few other operators would have been able to achieve.

We are not only a committed leader in emissions reduction and field measurement efforts, but we are also accelerating a 1.5-degree scenario through the growth of our asset base.[10] We believe that the collective goal of accelerating a rapid reduction of industry emissions should be the driving factor that shapes our strategy and we will do just that.


New Ventures focuses on the foundation for our evolution over the long-term through meaningful participation in energy transition opportunities. We believe that we will not only have opportunities to accelerate the path to a lower-carbon future, but also to develop, invest in, partner with, and acquire attractive, new, lower-carbon-supporting products and solutions to enhance the value of our durable base business.

To this end, in 2023, we continued to explore opportunities to develop, invest in, partner with, and acquire new ventures or otherwise pursue initiatives aligned with our Environmental, Social, and Governance (ESG) strategy. Read more about our investments in these initiatives in the New Ventures section of this report.

Taken together, these strategies influence our long-term trajectory to support the acceleration of the transition to a lower-carbon future. We believe our Evolve, Growth, and New Ventures strategy will allow us to react nimbly and effectively as data continues to emerge and technologies continue to develop on our collective path to a lower-carbon future.

Highlight Story
EQT and Context Labs Strategic Partnership

In April 2023, EQT and Context Labs established a strategic partnership to help EQT advance the commercialization of verified, lower-carbon intensity natural gas products and carbon credits. Context Labs, a leader in advanced climate data analytics, will support EQT in its efforts to scale emissions mitigation across its full energy value chain and achieve long-term emissions goals — including the certification and verification of the carbon intensity of EQT’s operated assets and supporting EQT in the generation of asset-grade, data-backed carbon credits.

To learn more about other new ventures in carbon credits, see Operational GHG Emissions.


[1] The “shale revolution” refers to the combination of hydraulic fracturing and horizontal drilling that enabled the United States to significantly increase its production of natural gas, particularly from tight shale formations, beginning predominately in 2005.

[2] Source: IEA (2023), World Energy Outlook 2023, IEA, Paris https://www.iea.org/reports/world-energy-outlook-2023, License: CC BY 4.0 (report); CC BY NC SA 4.0

[3] Source: EIA (2019), U.S. energy-related carbon dioxide emissions, 2019 (report); EQT has split wind and solar proportionally to their increased power generation from 2005 to 2019 per the EIA’s renewable generation data.

[4] Source: IEA (2023), World Energy Outlook 2023, IEA, Paris https://www.iea.org/reports/world-energy-outlook-2023, License: CC BY 4.0 (report); CC BY NC SA 4.0. Negative numbers represent emissions reductions, while positive numbers represent increases in emissions.

[5] Source: EIA (2022), Natural Gas Explained, chart showing U.S. natural gas imports and exports, 1950-2021 (https://www.eia.gov/energyexplained/natural-gas/imports-and-exports.php).

[6] IEA (2023), Greenhouse Gas Emissions from Energy Data Explorer, IEA, Paris, https://www.iea.org/data-and-statistics/data-tools/greenhouse-gas-emissions-from-energy-data-explorer; IEA (2023), Global coal demand set to remain at record levels in 2023, IEA, https://www.iea.org/news/global-coal-demand-set-to-remain-at-record-levels-in-2023

[7] Source: Low-Carbon Resources Initiative (2023), Net-Zero 2050: U.S. Economy-Wide Deep Decarbonization Scenario Analysis, December 2023 (https://lcri-netzero.epri.com/).

[8] Source: Statista (2022), Percentage Distribution of Household Income in the United States, September 2022 (https://www.statista.com/statistics/203183/percentage-distribution-of-household-income-in-the-us/).

[9] Source: The World Bank (2023), GDP per capita (current US$) (https://data.worldbank.org/indicator/NY.GDP.PCAP.CD).

 [10] Although consolidation would inherently increase our Scope 3 emissions from any future acquired operations (emissions that would exist even if they were not acquired by us), it would also put those operations in the hands of stewards such as EQT, accountable for accelerating emissions reduction efforts.

Accelerating the Lower‑Carbon Transition

The Beliefs that Drive Us

3-3
Management of material topic
SASB EM-EP-420a.4
Discussion of how price and demand for hydrocarbons or climate regulation influence the capital expenditure strategy for exploration, acquisition and development of assets
TCFD: Strategy – a, b
Disclose the actual and potential impacts of climate-related risks and opportunities on the organization’s businesses, strategy and financial planning.
3-3
SASB EM-EP-420a.4
TCFD: Strategy – a, b

We recognize the risks and opportunities that climate change poses to our business and have developed a strategy for how we can best address both transition and physical risks. This strategy is underpinned by our values; represents the short-, medium-, and long-term opportunities for our organization; and is built on three foundational beliefs, detailed below.

Belief 1: Natural gas is critical to accelerating a sustainable pathway to a lower-carbon future and achieving global climate goals.

Natural gas is a critical commodity to facilitate the growth of renewables as part of our power supply, domestically and internationally. Among sources of continuous and reliable power, natural gas leads in its combination of accessibility, low environmental impact, and exportability. As seen with recent power shortages, natural gas has served as a necessary fuel source and fills the gap left by the intermittency of renewable power. As the United States develops the technology necessary to scale renewable power, the volatility of demand within the power sector on non-renewable power will only increase. Through 2050, the long-term outlook from the U.S. Energy Information Administration (EIA) is that petroleum and natural gas will remain the most consumed source of energy in the United States as renewables continue to be added to the grid.[1] Furthermore, rapid replacement of coal-fired power generation with natural gas-fired power generation represents the most accessible and significant step to meaningfully accelerate our pathway to decarbonization — not just in the United States, but globally.

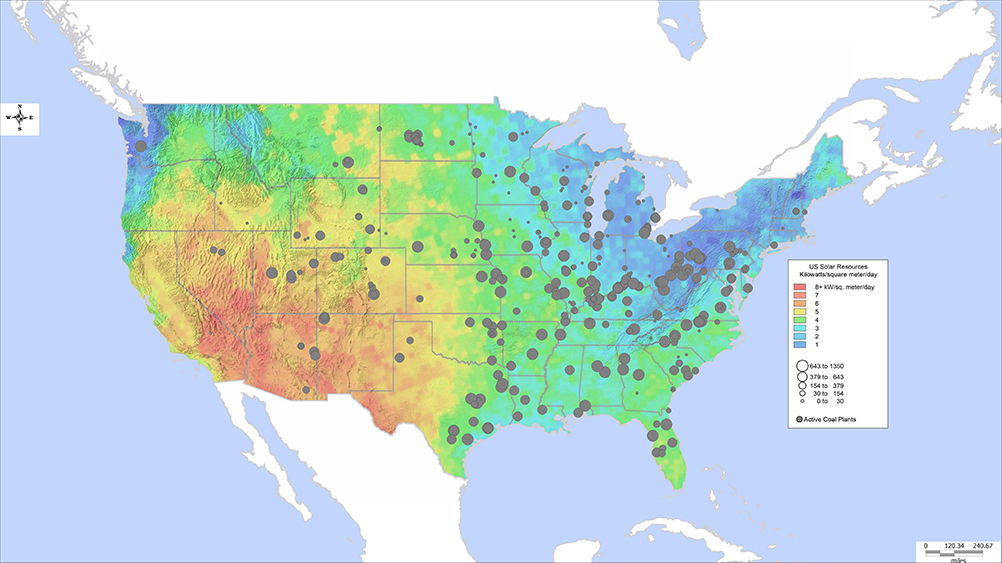
Domestically, renewable energy rapidly increases its impact on energy production. The benefits of increased renewable energy sources can be seen through the reduction in the electricity production share held by coal, which is the highest GHG-intensive component of the U.S. electricity generation mix. However, the ability and pace at which the United States can replace coal-fired power generation with renewables will be challenged in areas where replacement is most needed, as a significant amount of coal-fired power generation in the United States is in regions characterized by low renewable power potential.

For instance, solar panels in the northeastern and southeastern United States are only about 15% and 50%[2] as effective, respectively, as solar panels in the southwestern United States. As such, up to eight times the materials and acreage would be needed to generate the same amount of energy from a solar panel in other parts of the United States as it would in the southwestern United States. This reduced efficiency not only impacts the economics of a solar project but also the reliability of the power generated.

U.S. Solar and Coal Resource Availability[3]

Map of the U.S. showing solar resource availability in kilowatts per square meter per day. The highest solar availability is in the Southwestern U.S. with the lowest availability in the Northeastern U.S. The map also displays active coal plants, largely concentrated in the Eastern U.S.

Outside of the United States, much of the world still has an energy mix roughly equivalent to that of the United States in 2005. In 2023, as total global energy-related carbon dioxide (CO2) emissions reached a new all-time-high, increasing by 410 million tons compared to 2022, reports indicated that coal accounted for more than 65% of that increase.[4] As natural gas played the leading role in emissions reduction seen within the United States from 2005 to 2019, so too should it play the same role at the international level today.

Even if the United States achieved net-zero emissions today, the world would still be on a trajectory to miss its climate goals, in large part because of the significant global consumption of coal. As the largest producer of natural gas in the world,[5] the United States must accept its responsibility to provide natural gas to coal-reliant countries to assist them with their necessary carbon reduction efforts.

Belief 2: Natural gas (particularly Appalachian natural gas) will differentiate itself from other hydrocarbons as the optimal source for reliable, affordable, and responsibly sourced energy.

As the debate about the energy future plays out, we believe greater differentiation will occur between hydrocarbons and producers of hydrocarbons. We also believe there will be greater differentiation between natural gas-focused and oil-focused companies. While the production methods are similar, the consumption of oil-based products versus natural gas-based products, and the pathways to decarbonize that consumption, most effectively differ.

Emissions intensities of natural gas and oil companies are strikingly different. While we believe that all work to reduce their intensities, natural gas companies have a significant advantage. Much like how we see natural gas different from oil and coal, we see specific natural gas sources different from others. Production of domestic natural gas, and especially natural gas produced in Appalachia — such as in the Marcellus and Utica basin — has emissions intensities lower than other domestic and foreign supply sources.[6] As a result, natural gas companies (and Appalachian natural gas companies in particular) hold a meaningful advantage in the costs that will be incurred by such companies to achieve net-zero emissions.

As principal end uses differ between natural gas (power) and oil (transportation), the trajectories and cost-benefit analysis of natural gas and oil differ as well. Moreover, the primary pathways to accelerating the lower-carbon transition of one product’s end use (transportation) are through increased usage of the other’s (power for vehicle electrification and hydrogen-based transportation). As such, we believe that as the energy transition debate evolves and the focus on potential solutions shifts from supply to consumption, the traditional grouping of oil and natural gas companies will diverge. 

Belief 3: U.S. natural gas has the unique potential to be the largest green initiative on the planet.

In 2005, the United States was a major consumer of coal. Over the next approximately 15 years, the United States proceeded to become a world leader in emissions reductions, predominately with the use of gas-fired power in lieu of coal-fired power generation. Between 2010 and 2022, the United States reduced its carbon emissions by nearly 800 million MT[7] with coal-to-gas substitution as a significant portion of U.S. emissions reductions.[8]

According to the International Energy Agency (IEA), global coal demand reached a record high in 2022 due to the global energy crisis, up 4% compared to 8.42 billion tons in 2021.[9] Two countries, China and India, account for the significant majority of global coal consumption — China alone accounted for nearly 55% of global coal consumption in 2022.[10] Approximately 124 gigawatts (GW) of coal power plants were under construction in China and India as of the end of 2021 (comprising over 70% of global coal plants under construction), with another 182 GW in pre-construction.[11] These newly constructed coal plants would equate to over three times the coal capacity retired by the United States from 2013 through 2020.[12]

China and India Combined Coal CO2 Emissions[13]

Graphic illustrating the increase in China and India's combined coal carbon dioxide emissions from 2000 to 2022, rising from approximately 3 billion metric tons to approximately 10.1 billion metric tons.

Natural gas power generation has unique attributes that make it an optimal alternative to coal power generation, including the following:

  • Natural gas power plants provide baseload energy, which complements intermittent energy sources like wind and solar;
  • Natural gas plants run more efficiently than coal plants (approximately one natural gas plant can replace two coal plants);[14]
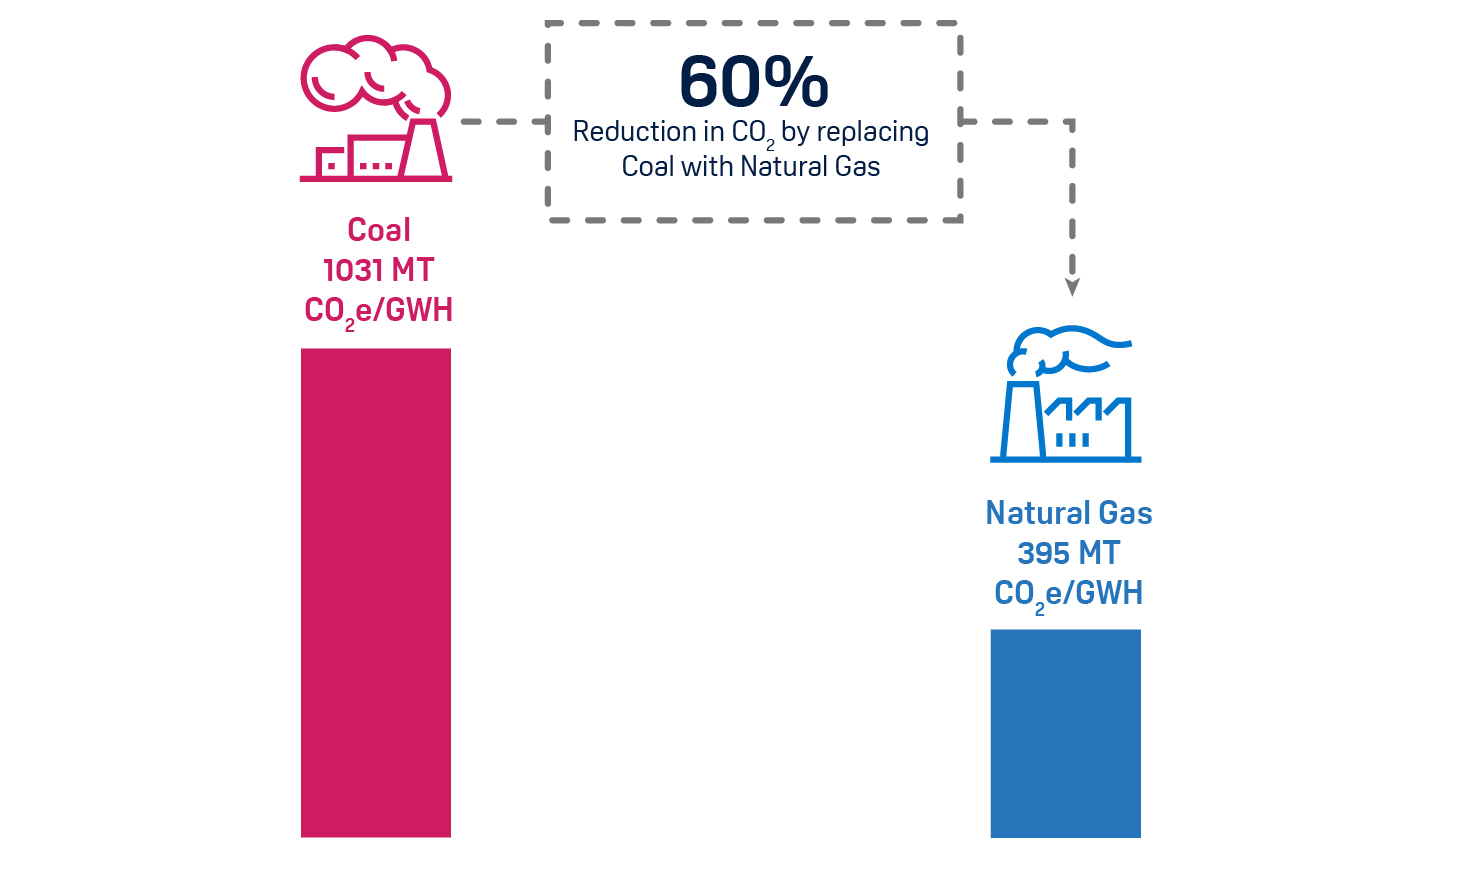
  • Natural gas emits 60% less carbon than a comparable amount of coal;[15]
  • Natural gas has a lower emissions intensity compared to oil and coal; and
  • Natural gas is relatively affordable compared to other fossil fuels and renewable sources.

We believe that the replacement of international coal with U.S. natural gas should be our primary focus in global emissions reduction. If we were to quadruple U.S. liquefied natural gas (LNG) capacity to 55 Bcf per day[16] by 2030, we believe we could reduce international carbon emissions by an incremental 1.1 billion MT per year — a 60% reduction in global carbon emissions.

The emissions reduction impact of an unleashed U.S. LNG scenario would have a combined effect equal to the following:

  • Electrifying every U.S. passenger vehicle;
  • Powering every home in America with rooftop solar and backup battery packs; and
  • Adding 54,000 industrial-scale windmills, doubling U.S. wind capacity. 

Two bars comparing the carbon dioxide emissions equivalent (CO2e) per giga watt hour of electricity produced (GWH) of coal versus natural gas. Replacing coal with natural gas leads to a 60% reduction in CO2e, from 1031 CO2e/GWH to 395 CO2e/GWH.

Additionally, as U.S. LNG is unleashed from the basin, U.S. citizens that own land resources with natural gas production capacity would be paid for this initiative in the form of tax revenues and annual royalties.

Highlight Story
EQT Joins the Oil and Gas Decarbonization Charter

In 2023, as part of our engagement in The 28th United Nations Climate Change Conference (COP28) in Dubai, EQT became the first independent, domestic operator to sign onto the Oil and Gas Decarbonization Charter (OGDC). The OGDC supports the aims of the Paris Agreement and calls for the industry to align around net-zero by or before 2050, zero-out methane emissions, and eliminate routine flaring by 2030. It was signed by 50 oil and gas companies from around the world.

Beyond decarbonization, signatories recognize it is essential for the oil and gas industry to increase actions, including engagement with customers, invest in the energy system of the future, and improve transparency in measurement, reporting, and independent verification of GHG emissions. The charter is a key initiative under the Global Decarbonization Accelerator (GDA)[17] — and it is a testament to our leadership on emissions reduction.

[1] Source: EIA (2022), Annual Energy Outlook 2022, March 2022 (https://www.eia.gov/pressroom/releases/press496.php).

[2] Based on kilowatts per square meter per day. Source: Hitachi ABB Power Grids. Data as of March 20, 2023.

[3] Source: Hitachi ABB Power Grids. Data as of March 20, 2023.

[4] Source: IEA (2024), CO2 Emissions in 2023, March 2024 (https://iea.blob.core.windows.net/assets/33e2badc-b839-4c18-84ce-f6387b3c008f/CO2Emissionsin2023.pdf), showing 2023 total global energy-related CO2 emissions as 37.4 Gt.

[5] Enerdata, World Energy & Climate Statistics — Yearbook 2023 (https://yearbook.enerdata.net/natural-gas/world-natural-gas-production-statistics.html).

[6] Source: Clean Air Task Force (2023), Benchmarking Methane and Other GHG Emissions of Oil & Natural Gas Production in the United States, May 2023
(https://cdn.catf.us/wp-content/uploads/2023/05/22103159/OilandGas_BenchmarkingReport_2023.pdf?).

[7] Source: IEA (2023), World Energy Outlook 2023, IEA, Paris https://www.iea.org/reports/world-energy-outlook-2023, License: CC BY 4.0 (report); CC BY NC SA 4.0.

[8] Source: EIA (2019), U.S. energy-related carbon dioxide emissions, 2019 (report); EQT has split wind and solar proportionally to their increased power generation from 2005 to 2019 per the EIA’s renewable generation data.

[9] Source: IEA (2023), Coal 2023, IEA, Paris https://www.iea.org/reports/coal-2023, License: CC BY 4.0.

[10] Statista (October 2023), Coal consumption worldwide from 1998 to 2022 (https://www.statista.com/statistics/265507/global-coal-consumption-in-oil-equivalent/#:~:text=In%202022%2C%20coal%20consumption%20worldwide,exajoules%20in%20the%20previous%20year); Statista (January 2024), Consumption of coal in China from 1998 to 2022 (https://www.statista.com/statistics/265491/chinese-coal-consumption-in-oil-equivalent/).

[11] Source: Global Energy Monitor (2022), 2022 Boom and Bust Coal, April 2022 (https://globalenergymonitor.org/wp-content/uploads/2022/04/BoomAndBustCoalPlants_2022_English.pdf).

[12] Between 2013 and 2020, the United States retired 101.3 GW of coal capacity. Source: Global Energy Monitor (2021), 2021 Boom and Bust Report, April 2021 (https://globalenergymonitor.org/report/boom-and-bust-2021-tracking-the-global-coal-plant-pipeline-2/).

[13] India Source: Statista (December 2023), Carbon dioxide emissions from fossil fuel combustion in India from 1960 to 2022, by type (https://www.statista.com/statistics/1282696/carbon-dioxide-emissions-from-fossil-fuel-use-in-india/); China Source: Statista (January 2024), Carbon dioxide emissions from coal use in China from 1960 to 2022 (https://www.statista.com/statistics/1198032/carbon-dioxide-emissions-from-coal-use-in-china/#:~:text=Coal%20use%20in%20China%20released,emissions%20in%20China%20that%20year).

[14] Source: EIA (2023), Carbon Dioxide Emissions Coefficients (https://www.eia.gov/environment/emissions/co2_vol_mass.php); EIA, 2023, Table 8.1 Average Operating Heat Rate for Selected Energy Sources, 2011-2021 (https://www.eia.gov/electricity/annual/html/epa_08_01.html).

[15] Source: EIA (2023), Carbon Dioxide Emissions Coefficients (https://www.eia.gov/environment/emissions/co2_vol_mass.php); EIA, 2023, Table 8.1 Average Operating Heat Rate for Selected Energy Sources, 2011-2021 (https://www.eia.gov/electricity/annual/html/epa_08_01.html).

[16] Including current capacity, capacity under construction, and future new capacity.

[17] The GDA was launched at the World Climate Summit during COP28. It focuses on three key pillars: rapidly scaling the energy system of tomorrow, decarbonizing the energy system of today, and targeting methane and other non-CO2 GHG emissions.

what we are doing

Governance

3-3
Management of material topic
2-12
Role of the highest governance body in overseeing the management of impacts
TCFD: Governance – a, b
Disclose the organization’s governance around climate-related risks and opportunities.
3-3
2-12
TCFD: Governance – a, b

We maintain a management-led ESG Committee, comprising our Chief Executive Officer, General Counsel, and other senior leaders, which bears the primary responsibility to identify and manage applicable climate-related risks and opportunities. Our ESG Committee also helps our executive team and senior management in developing, implementing, and monitoring initiatives, processes, policies, and disclosures that pertain to climate risks and opportunities.

Illustration of EQT's ESG Governance Structure, showing the relationship between the Board of Directors, which includes the Corporate Governance Committee and Public Policy and Corporate Responsibility Committee. These committees in turn oversee the ESG Committee, which oversees the Environmental Health and Safety; Production; Legal; Human Resources and Public Relations; New Ventures; and Commercial Teams.

The Corporate Governance Committee and the Public Policy and Corporate Responsibility (PPCR) Committee of our Board of Directors routinely evaluate and provide oversight, guidance, and perspective on our climate risks and initiatives including our emissions reduction targets. Our General Counsel and our Vice President of Environmental, Health, and Safety provide quarterly updates on our climate initiatives to the PPCR Committee and annual updates to our Corporate Governance Committee. In response to such updates, the PPCR Committee and the Corporate Governance Committee provide comments and feedback on our climate risk management and emissions reduction initiatives and targets, which are relayed to our ESG Committee.

Our Environmental, Production, Finance, and Business Information Technology teams work collaboratively to explore and implement innovative technologies to collect, report, forecast, and reduce our emissions and manage our other climate risks in line with initiatives established by our ESG Committee. Oversight of these initiatives is managed through our digital work environment and monitored by our ESG Committee. For additional information on our Board committees, compensation programs, and ESG oversight, see Corporate Governance.

Risk Management

2-12
Role of the highest governance body in overseeing the management of impacts
2-13
Delegation of responsibility for managing impacts
TCFD: Governance – b
Disclose the organization’s governance around climate-related risks and opportunities.
TCFD: Risk Management – a, b, c
Disclose how the organization identifies, assesses, and manages climate-related risks.
2-12
2-13
TCFD: Governance – b
TCFD: Risk Management – a, b, c

Our Enterprise Risk Committee, which is chaired by our General Counsel and includes other members of senior management, oversees identification and management of corporate-level risks using the COSO Enterprise Risk Management Framework. To align our focus on our primary business risks, our Enterprise Risk Committee surveys senior leaders annually to assess our most significant, or “Tier 1,” enterprise risks. Based on this survey, our Enterprise Risk Committee creates a list of our top risks and presents this information to our Board of Directors on an annual basis. Our Enterprise Risk Committee also conducts quarterly follow-up assessments to re-rank top risks and identify new or more effective measures for mitigation.

Our Enterprise Risk Committee has delegated primary responsibility for identification and management of climate-related risks to our ESG Committee. 

Our Production, Completions, and Finance teams use models and forecasts to assess the impact of our identified risks. Assessing the impact of our identified risks includes financial modeling and commodity forecasting. For climate change specifically, we consider risks to our business including accessibility of water for our operations and demand for natural gas, renewables, and other energy sources. We also use various carbon-pricing projections based on the Regional GHG Initiative and the California Carbon Credit Exchange to model different carbon-pricing scenarios and the corresponding impacts on our operations and financial profile. For more information on how recent legislation and regulation may impact EQT, see “Climate Change and Regulation of Methane and Other Greenhouse Gas Emissions” in our 2023 Form 10-K.


Close button for share
SHARE