Corporate Profile
EQT Corporation (NYSE: EQT) is a premier, vertically integrated American natural gas company with operations focused in the Appalachian Basin, one of the lowest carbon- and methane-intensive basins in the United States. We are dedicated to responsibly developing our world-class asset base and being the operator of choice for all our stakeholders. We emphasize operational efficiency, technology, and sustainability while continuously improving the way we produce and deliver natural gas — a reliable, lower-carbon, and cost-effective energy source. Our dedication to the safety of our employees, contractors, and communities, as well as to the reduction of our overall environmental footprint, remains a priority for our operations. Our core values — Trust, Teamwork, Heart, and Evolution — guide our actions and shape the way we engage with our stakeholders each day.
Promises Delivered


Our mission is to deliver affordable, reliable, cleaner energy to the world.
As one of the largest natural gas producers in the United States, we are committed to evolving energy and strengthening the critical role that natural gas plays in the future energy mix, both domestically and abroad.
We aim to maximize the value derived from our assets while we minimize the environmental impact of our operations through technological innovation. We strive to improve the way we perform, maintain a rewarding and collaborative workplace, and actively engage with landowners and the communities where we operate and where our employees live and work. Furthermore, we aim to push the boundaries of operational performance and leverage innovative technology and human capital to execute our combo-development strategy — leading to a step-change in operational efficiency.
In 2024, we produced over 2,100 billion cubic feet of natural gas equivalent (Bcfe) in gross hydrocarbon production.[1] As of December 31, 2024, we maintained 26.3 trillion cubic feet of natural gas equivalent of proved natural gas, natural gas liquids (NGLs), and crude oil reserves across approximately 2.1 million gross acres and nearly 3,000 miles of pipeline infrastructure. We also operate and hold an investment in the Mountain Valley Pipeline (MVP), a more than 300-mile-long pipeline that runs from West Viriginia to Virginia. Approximately 99% of our gross production is natural gas and NGLs. With 1,461 employees as of December 31, 2024, we generated approximately $5.3 billion in total operating revenues in 2024.
We have historically pursued and will continue to explore opportunities to create value through strategic transactions, including mergers and acquisitions, divestitures, and joint ventures, or similar business transactions.
In 2021, we acquired assets located in the Appalachian Basin (the Alta Assets) from Alta Resources Development, LLC (Alta). Data from the Alta Assets is included in this report; however, we disclose production and sales volumes and emissions data related to the Alta Assets separately from our 2021–2024 data to track our progress against our 2025 emissions targets.
Additionally, in August 2023, we acquired THQ Appalachia I Midco, LLC (Tug Hill) and THQ-XcL Holdings I Midco, LLC (XcL Midstream). XcL Midstream’s gathering and processing assets (the XcL Assets) added 145 miles of owned and operated midstream gathering systems to our operations, which connect to every major long-haul interstate pipeline in southwest Appalachia. Data from the XcL assets, along with Tug Hill’s production assets (the Tug-XcL Assets) is included in this report; however, we disclose 2023 and 2024 production and sales volumes and emissions data related to these assets separately from our historical data.
More recently, in July 2024, we acquired Equitrans Midstream Corporation (Equitrans), creating America’s only large-scale, vertically integrated natural gas business. Equitrans’ gathering and transmission assets (the Equitrans Assets) provided more than 2,000 miles of pipeline infrastructure with extensive overlap and connectivity in our core area of operations. Unless otherwise specified, 2024 data from the Equitrans Assets is included in this report from the date of acquisition through December 31, 2024. We disclose greenhouse gas (GHG) emissions data related to the Equitrans Assets in a separate supplement to this report, titled Equitrans 2024 Greenhouse Gas Emissions Supplemental Report, which is available as an appendix. Both the GHG emission in the appendix and the air quality emissions in this report include the full year 2024 data for the Equitrans Assets.
Unless otherwise noted, all references to “EQT,” “we,” “our,” or “us” in this report refer collectively to EQT Corporation and its wholly-owned subsidiaries.
The Environmental, Social, and Governance (ESG) data presented in this report (and for the Equitrans 2024 Greenhouse Gas Emissions Supplemental Report) is based on the operational control approach, which means that metrics are based on all assets that EQT operated during January 1 through December 31, 2024, unless otherwise specified.
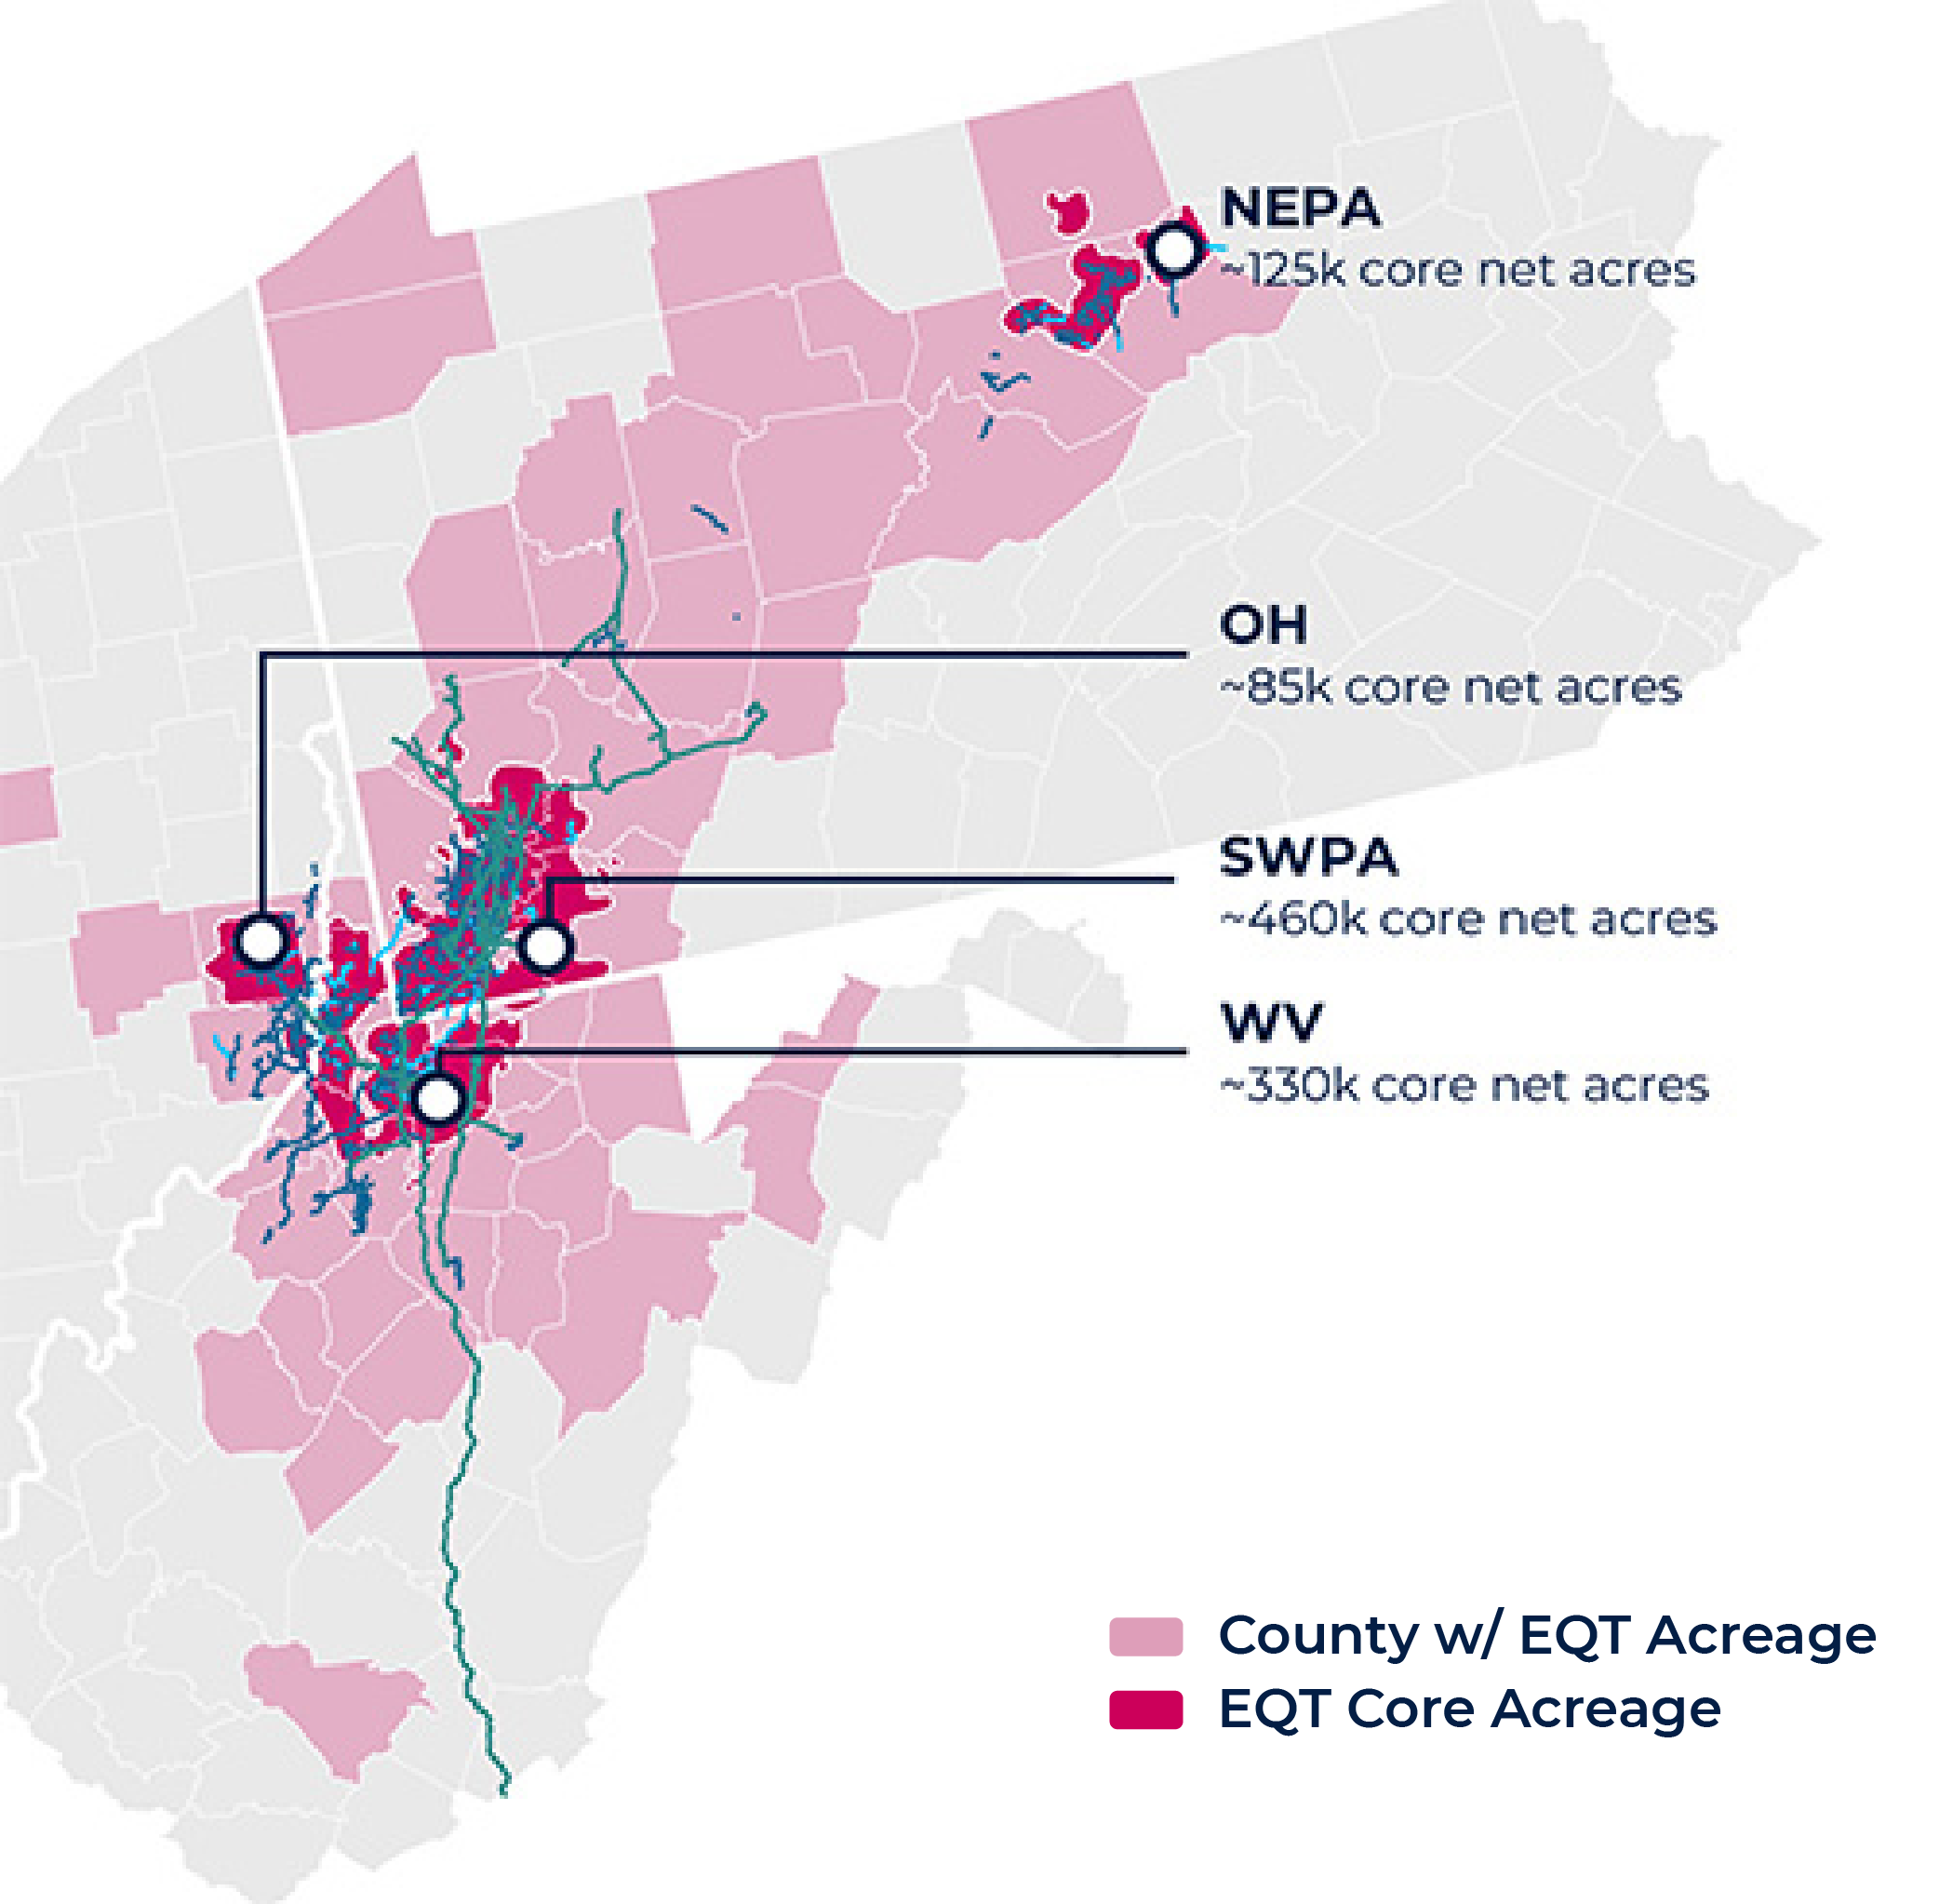
Our operations are predominately focused in Northeastern Pennsylvania (NEPA), Ohio (OH), Southwestern Pennsylvania (SWPA), and West Virgina (WV). See the illustration below for a map[2], [3] of our primary production and infrastructure locations.
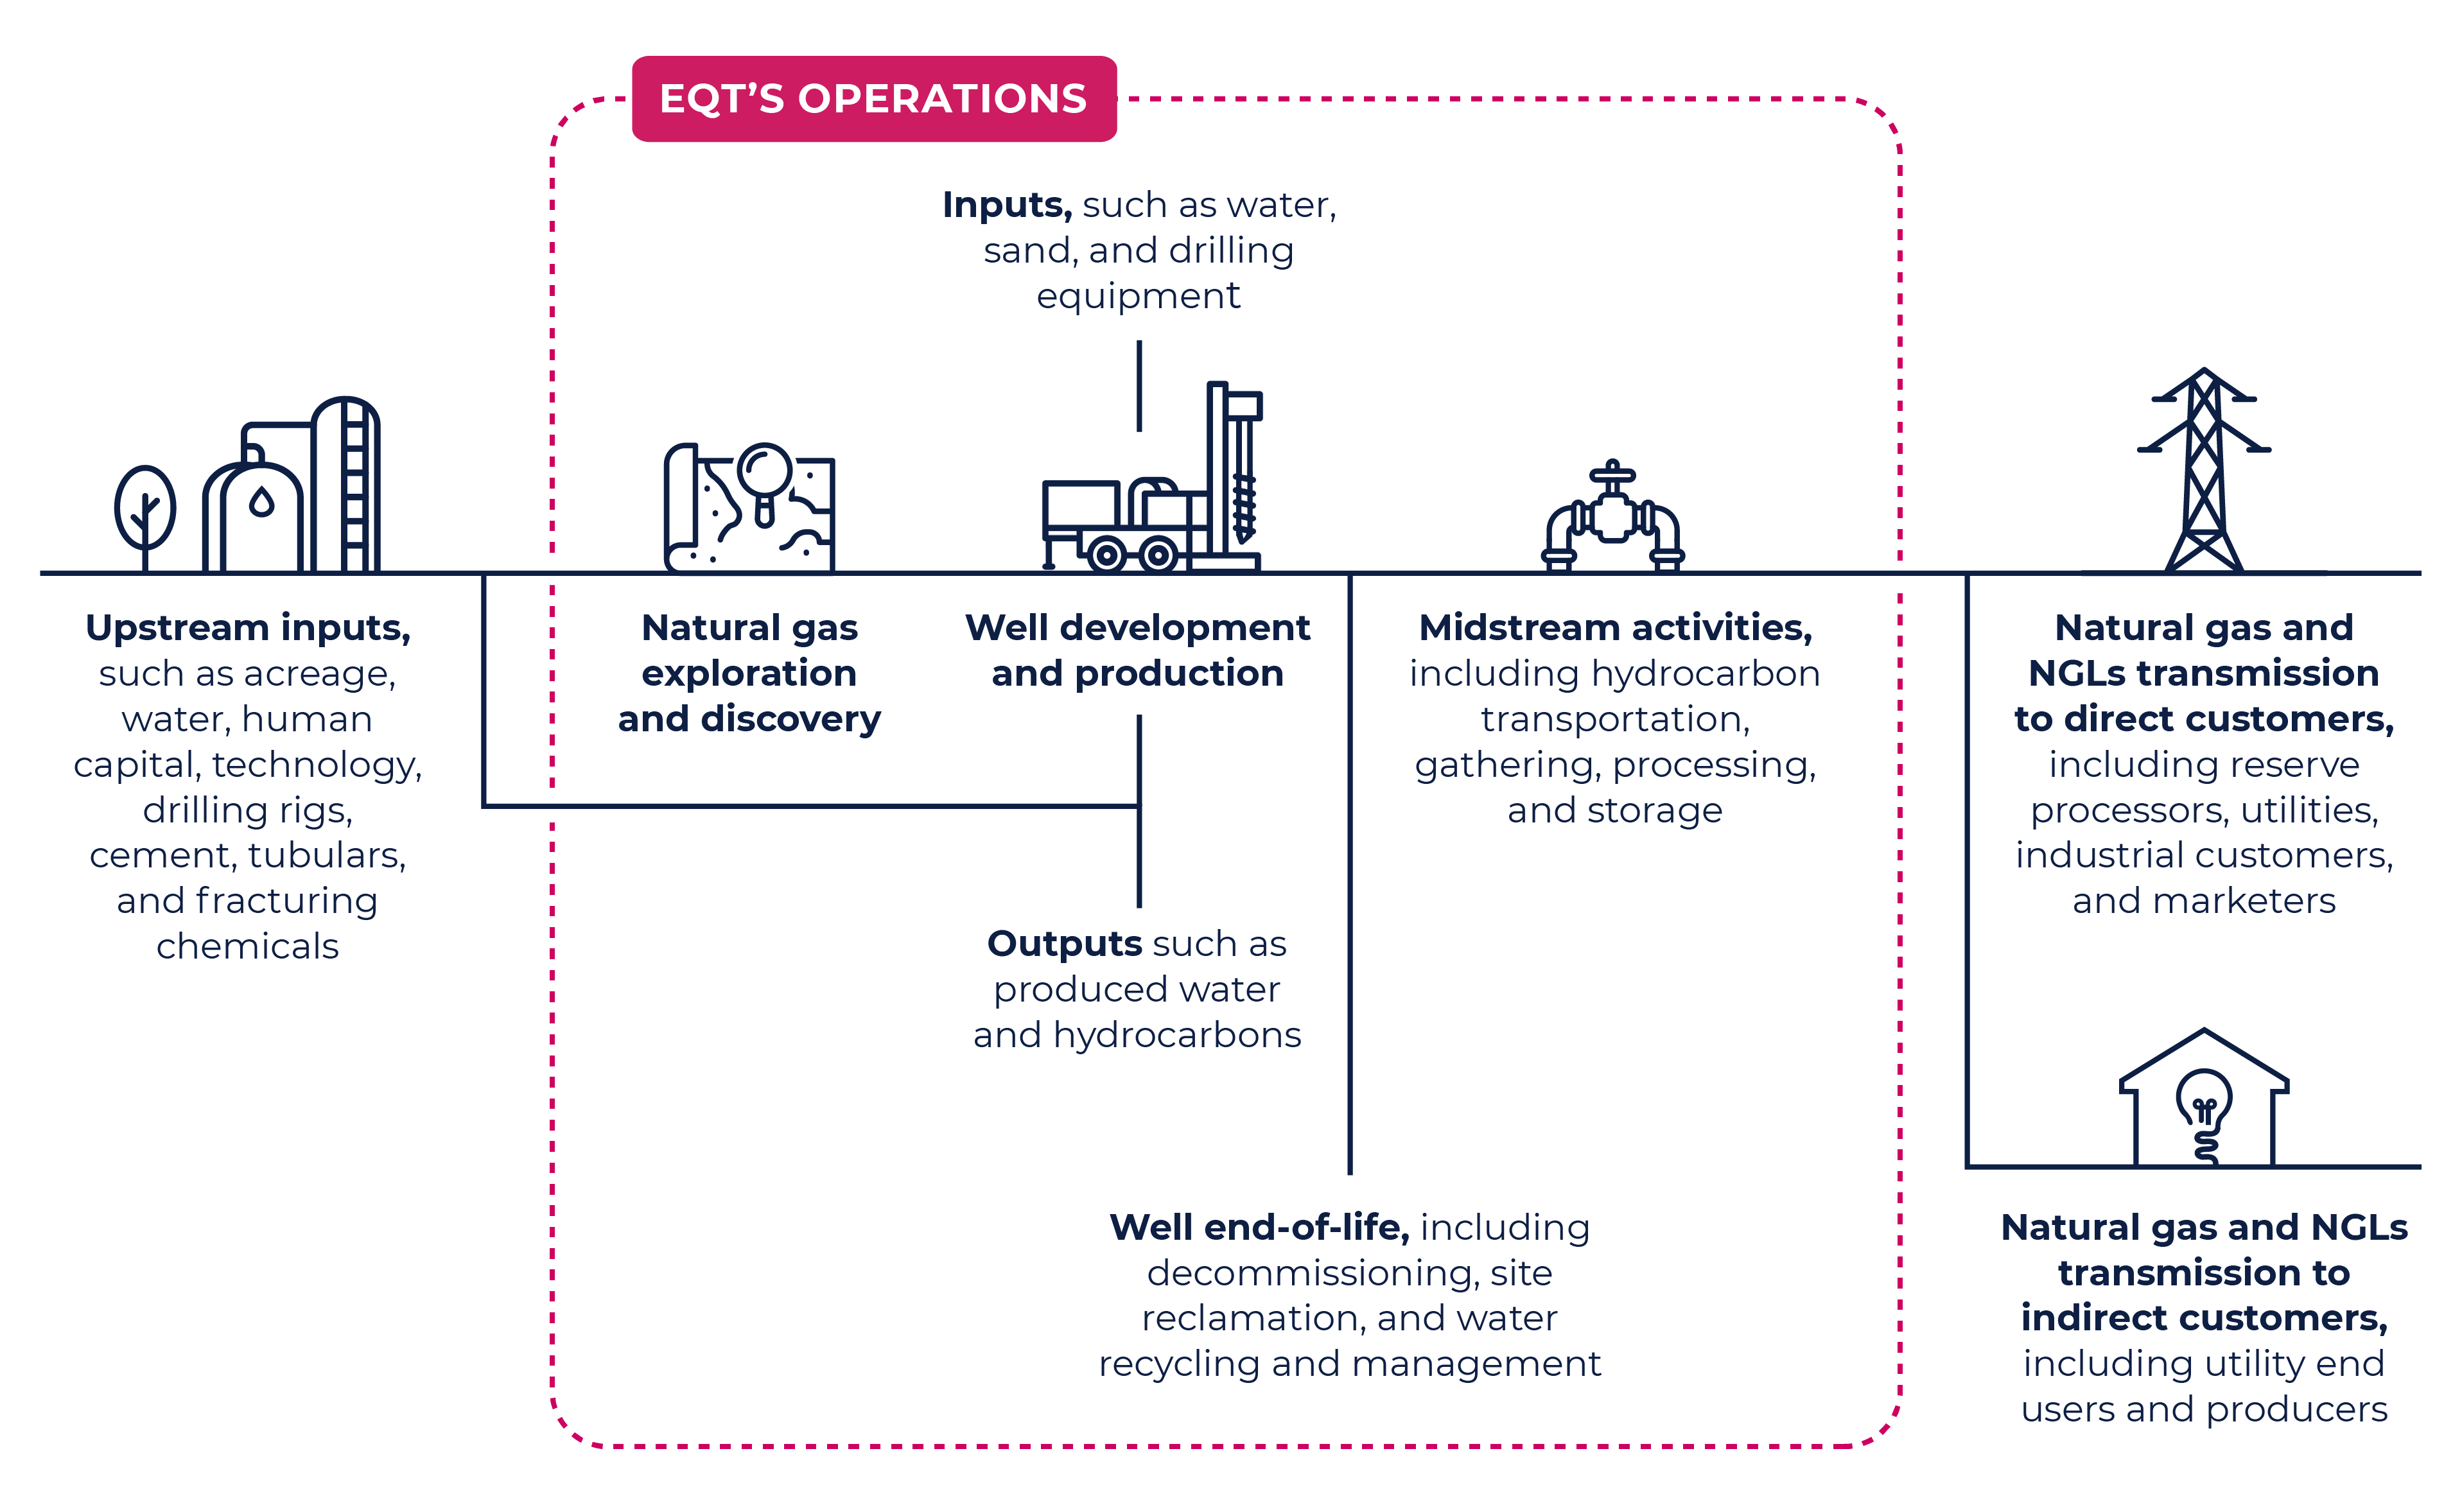
 The natural gas supply chain, from discovery to market delivery, is a complex series of interconnected activities. For end users to receive natural gas or natural gas-derived products, we must first find and produce the resource. Our investments span the discovery and production phase of the value chain — including drilling, completion, pumping, gas field services, casings for drilling, and information technology (IT) products. Additionally, our 2024 acquisition of the Equitrans Assets significantly expanded our midstream operations.
We produce, gather, and transport natural gas and, to a lesser extent, NGLs sold as a commodity to marketers, utilities, and industrial customers in the Appalachian Basin and in other demand regions accessible through our current transportation portfolio. Our transportation network includes access to key markets in the Gulf Coast, Midwest, and Northeast United States, and in Canada. As of December 31, 2024, 68.5% of our sales volume was sold outside Appalachia. We also contract with certain processors to market a portion of our NGLs on our behalf.
Our value chain is illustrated below.
EQT Value Chain
Highlight
Oil and Gas Acquisition of the Year in North America
EQT has been recognized by IJInvestor as the winner of the Oil & Gas Acquisition of the Year in North America for our landmark acquisition of Equitrans Midstream Corporation. The independent judging panel described the deal as “a fundamental game changer,” highlighting how the transformative transaction establishes EQT as the only large-scale, vertically integrated natural gas company in the United States.
We successfully closed the transaction ahead of schedule on July 22, 2024, navigating complex regulatory requirements, including approval from the Federal Energy Regulatory Commission (FERC).
President and Chief Executive Officer Toby Z. Rice commented, “We are excited to complete this highly strategic transaction significantly ahead of our original timeline and welcome both Equitrans employees and shareholders to EQT. The early close resulted in nearly $150 million of savings relative to our original forecast and brings forward our de-leveraging and synergy capture timetables.”
Our integration team — proved through years of experience with large-scale integration — is now focused on efficiently combining these organizations. EQT’s culture is rooted in operational efficiency, technology, and sustainability. This acquisition strengthens our ability to deliver environmentally responsible, reliable, and low-cost energy, while reinforcing our longstanding commitment to the safety of our employees, contractors, and communities.
Uniting under one cohesive culture, we are poised to build on our legacy and drive long-term success.
The table below shows our annual gross production using various standard industry denominations[3] to measure volumes of natural gas, oil/condensate, and NGLs.
Annual Gross Production[4]
| Metric | 2022 (EQT) | 2022 (Alta Assets) | 2023 (EQT) | 2023 (Alta Assets) | 2023 (Tug-XcL Assets)[5] | 2024 (EQT)[6] | 2024 (Alta Assets) | 2024 (Tug XcL Assets) |
| Natural Gas |
| Bcfe | 1,834 | 192 | 1,791 | 189 | 276 | 1,853 | 219 | 272 |
| MBOE | 305,683 | 31,967 | 298,526 | 31,480 | 46,045 | 308,798 | 36,571 | 45,355 |
| MMcf | 1,834,098 | 191,804 | 1,791,157 | 188,882 | 276,269 | 1,852,789 | 219,423 | 272,133 |
| Oil/Condensate |
| Bcfe | 14 | 0 | 14 | 0 | 19 | 7 | 0 | 11 |
| MBOE | 2,250 | 0 | 2,263 | 0 | 3,088 | 1,199 | 0 | 1,895 |
| Mbbl | 2,250 | 0 | 2,263 | 0 | 3,088 | 1,199 | 0 | 1,895 |
| Total Gross Production |
| Bcfe | 1,848 | 192 | 1,805 | 189 | 295 | 1,860 | 219 | 284 |
| MBOE | 307,933 | 31,967 | 300,789 | 31,480 | 49,133 | 309,997 | 36,571 | 47,250 |
In 2024, our daily gross production averages[7] (including production from the Alta Assets and the Tug-XcL Assets) were as follows:
- Natural gas: 6,423 million cubic feet (MMcf) per day
- Oil/Condensate: 8 thousand barrels (Mbbl) per day
For more information regarding our reserves and productive and in-process wells see our 2024 Form 10-K and 2025 Proxy Statement.
EQT’s Digital Work Environment (DWE) keeps every employee connected, whether in-office, remote, or in the field. The DWE enables real-time communication, centralizes organizational knowledge, generates data-driven insights, and integrates work processes. This platform ensures transparency and provides every employee equal opportunity to contribute, collaborate, and drive our mission of becoming the operator of choice for all stakeholders. Adherence to user guidelines helps ensure our data is clean, consistent, and aligned. This approach not only fuels innovation, but also promotes a culture of accountability and continuous improvement — essential for executing on our broader ESG commitments.
Promises Delivered
Our DWE is so effective in driving open communication and collaboration that we have been able to successfully transition approximately 57% of our employee workforce to remote work arrangements. For more information about how our remote work arrangements benefit employees and EQT, see Talent Attraction and Retention.
Our commitment to robust, integrated data systems lays the groundwork for the ongoing evolution of our business processes. By capturing data accurately and in real time across all departments, we not only support immediate operational needs, but also prepare for long-term strategic growth. This data-centric approach ensures that every decision is informed by comprehensive insights that reinforce our commitment to excellence in ESG performance and broader business innovation.
To further enhance our operations, EQT launched a new “Program Initiative” in 2024. Programs represent department-level strategies directed at managing and evolving the business, with Program owners empowered to drive execution through clearly defined Program milestones. Each Program is structured around key resources, including:
- Qrew Metrics: Tools for tracking performance.
- Utilities: The essential building blocks of our business processes.
- Enterprise Applications: The technological infrastructure that underpins our operations.
- EQT Roles: The collaborative manpower driving our success.
- Sessions: Facilitated engagements to enhance teamwork and idea sharing.
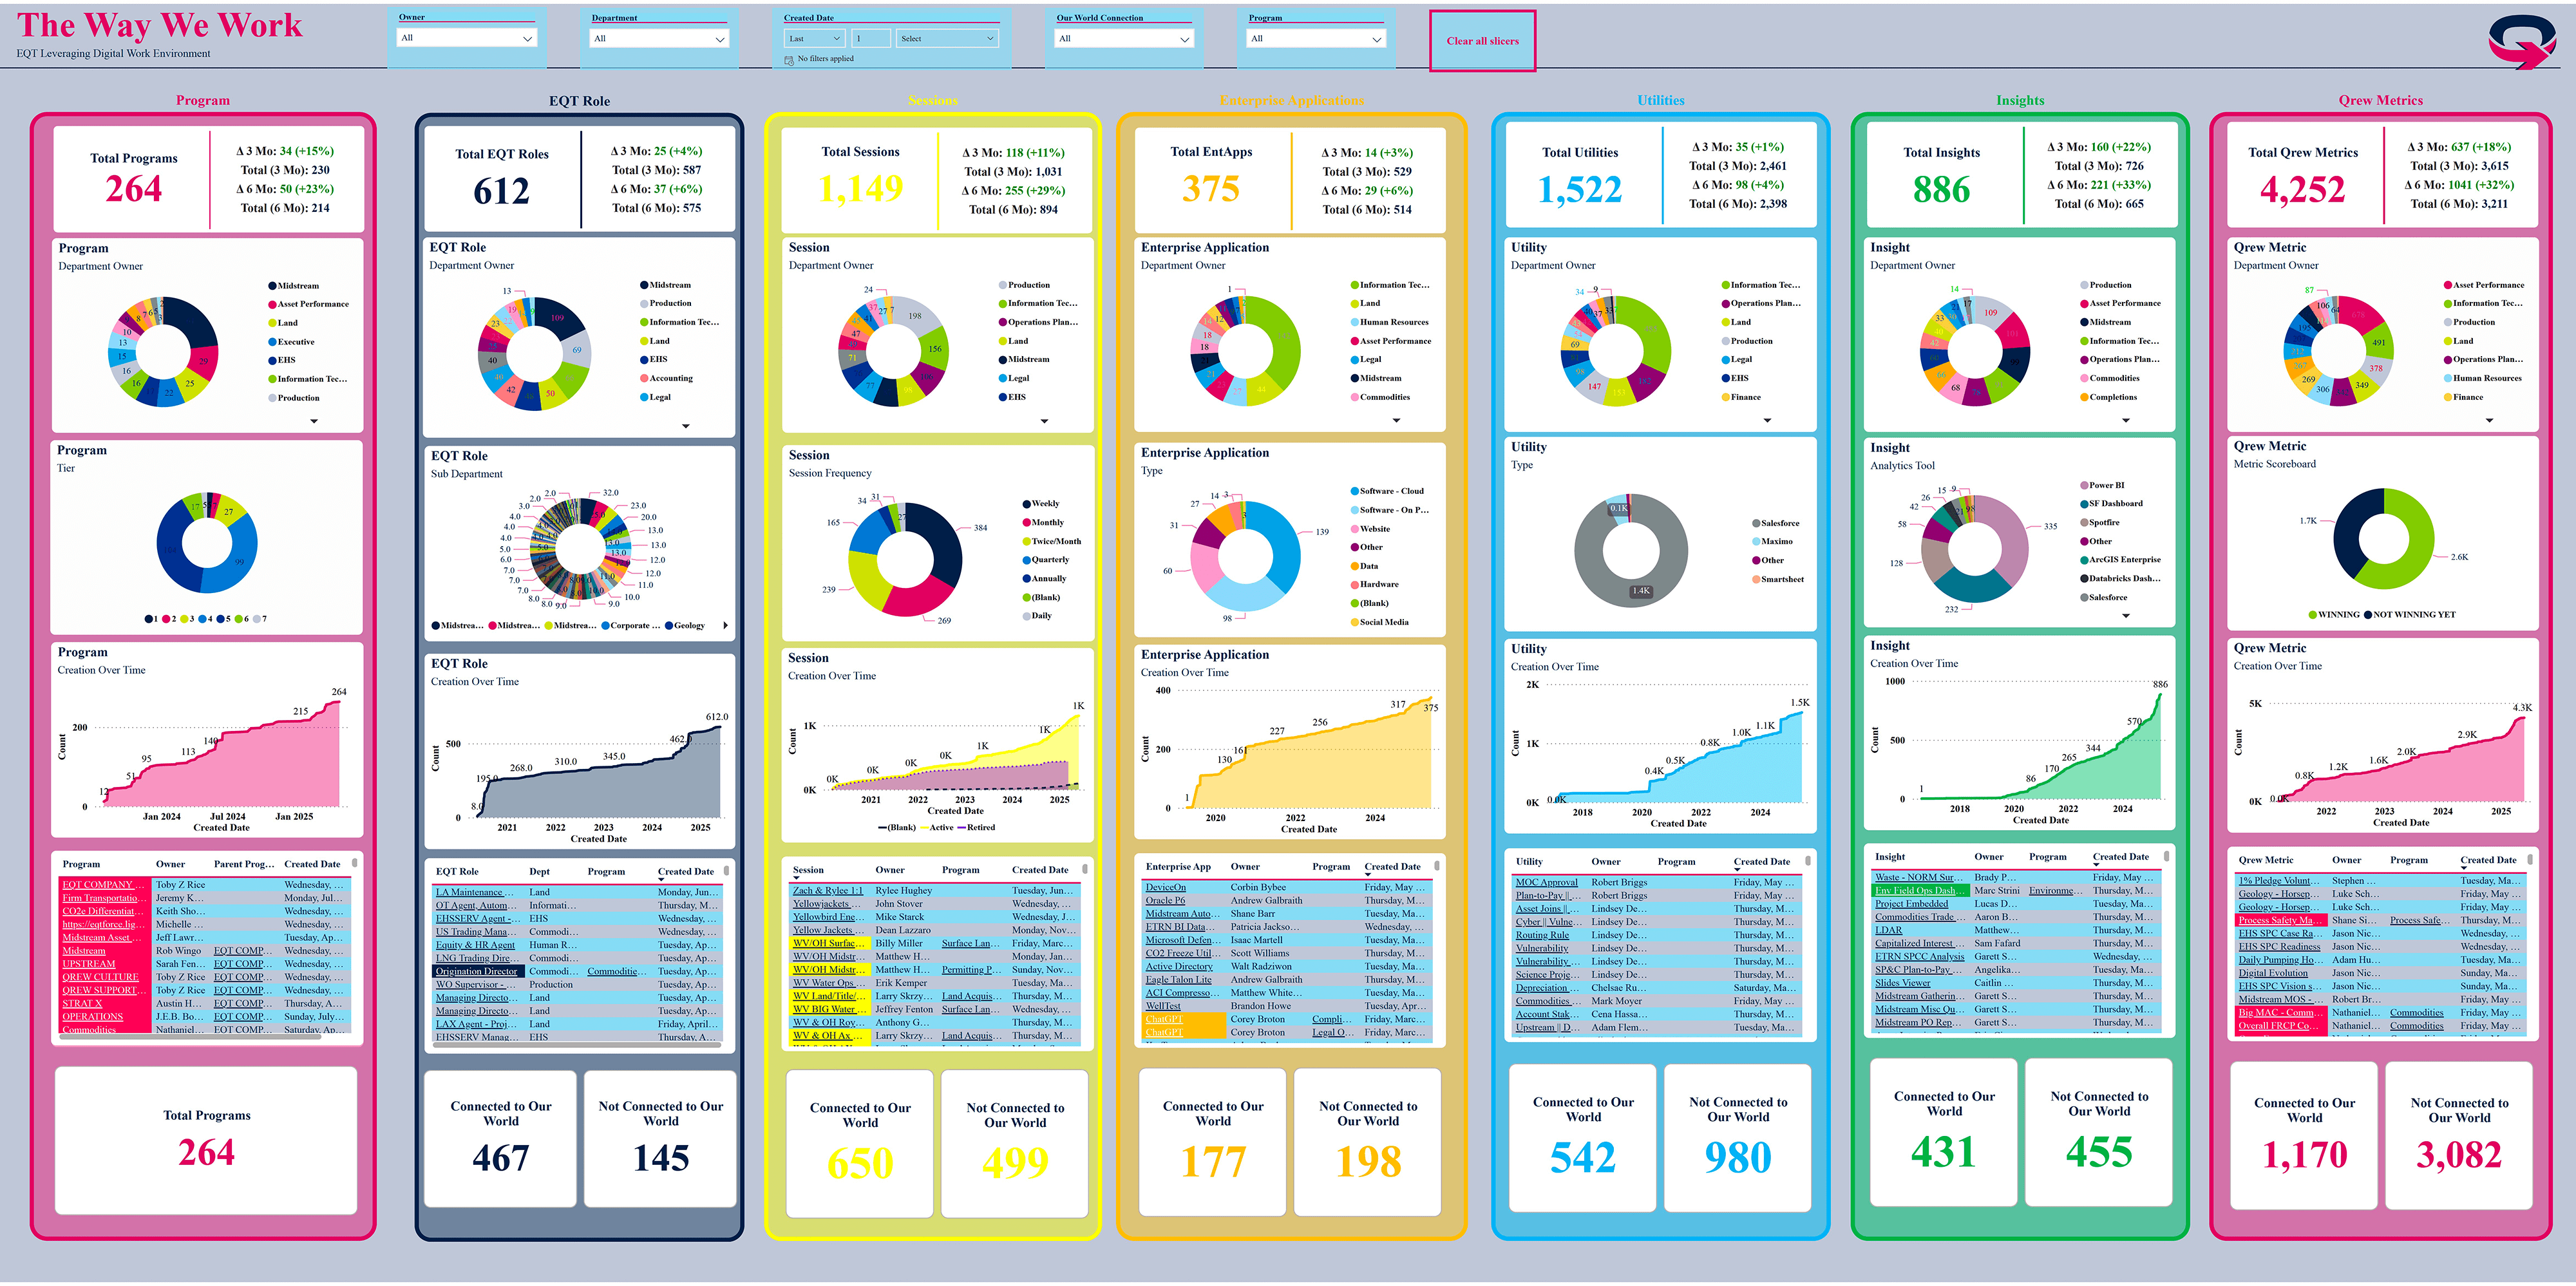
Each department’s Program is available for all employees to view within our DWE, and includes a vision deck, lists goals for the year, and identifies the Program owner and each member of the department who is responsible for executing on different aspects to achieve the stated department goals. Employees can visualize, track, and monitor their individual and department-wide progress of their Programs using a digital dashboard in our DWE, shown below. The dashboard ensures that EQT’s strategic initiatives remain transparent, measurable, and agile. The dashboard also showcases the interconnectivity of our core operations.
Our World Insight Dashboard
Our use of technology in our DWE is central to fostering cross-department collaboration, ensuring clean, consistent data capture to power future artificial intelligence (AI) initiatives, and enabling the evolution of our business processes. We believe innovation can arise from any level of our organization, so we maintain open channels for submitting ideas that improve our operational efficiency, company culture, employee engagement, and ESG performance.
We continue to drive innovation through our streamlined Innovation Pipeline, a function within our DWE which provides a single channel employees can use to submit ideas for new technology applications or process improvements. In 2024, our Innovation Pipeline delivered many new applications, including 105 new utilities, which will serve as the building blocks for future business processes that enable users to interact effectively with data.
We also develop meaningful ideas and effective solutions to enhance our innovation process through:
- The Information Technology Prime function of our Innovation Pipeline, which allows us to identify well-planned ideas that satisfy general guidelines and accelerate implementation within 2 weeks of approval.
- Special Project Cases, which is the process used for submitting and reviewing ideas that specifically address emerging technological challenges and opportunities in alignment with our strategic objectives. Employees’ proposals are reviewed by our IT team and are prioritized using direct input from business leaders.
Our Innovation Pipeline has enhanced our innovation process and has given our business the tools to develop meaningful ideas and allow us to deliver quick and effective solutions.