ESG Reports
2023
2022
2021
2020
2019
Historical Reports
2019 Corporate Social Responsibility Report (on CY2018 data)
2018 Corporate Social Responsibility Report (on CY2017 data)
2017 Corporate Social Responsibility Report (on CY2016 data)
2016 Corporate Social Responsibility Report (on CY2015 data)
2015 Corporate Social Responsibility Report (on CY2014 data)
2014 Corporate Social Responsibility Report (on CY2013 data)
2013 Corporate Social Responsibility Report (on CY2012 data)
2012 Corporate Social Responsibility Report (on CY2011 data)
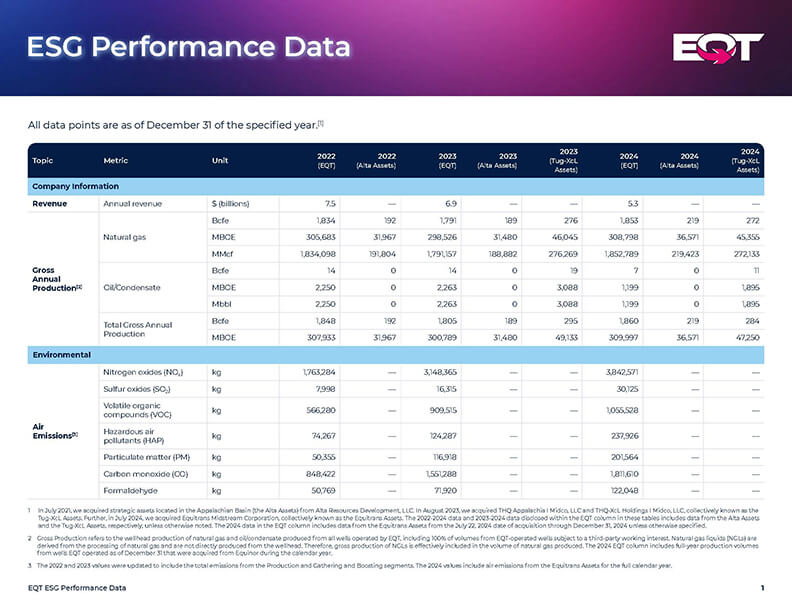
ESG Performance Data
American Exploration and Production Council (AXPC) ESG Metrics[1],[2]
| Topic | Metric | 2022 | 2023 | 2024 |
|---|---|---|---|---|
| Production of Hydrocarbons | Gross Annual Production of Oil/Condensate (Bbl) | 2,250,243 | 5,351,256 | 3,093,351 |
| Gross Annual Production of Natural Gas (Mcf) | 2,025,902,436 | 2,256,308,164 | 2,344,344,755 | |
| Total Gross Annual Production (Boe) | 339,900,649 | 381,402,617 | 393,817,477 | |
| Total Gross Annual Production (MBoe) | 339,901 | 381,403 | 393,817 | |
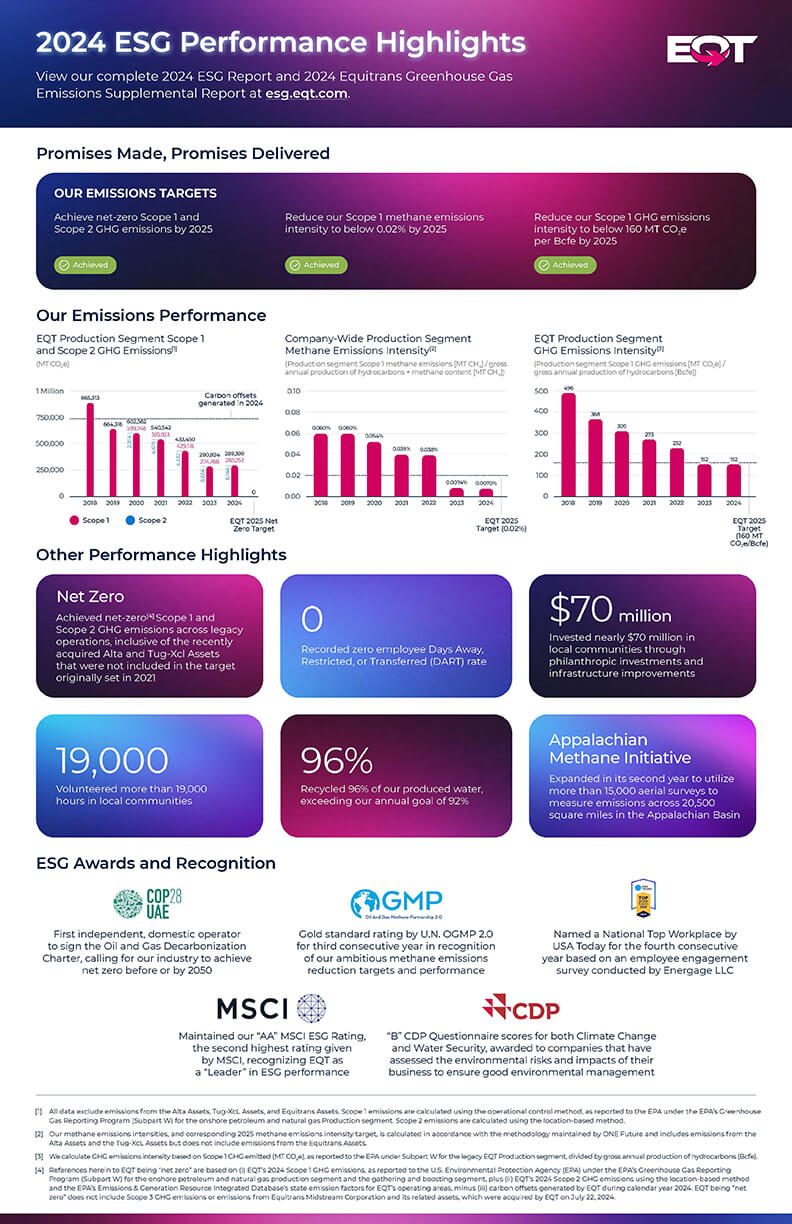
| Scope 1 GHG Emissions (MT CO2e)[6] | 683,821 | 668,626 | 661,556 | |
| Scope 1 GHG Intensity (#) | 2.01 | 1.75 | 1.68 | |
| Percent of Scope 1 GHG Emissions Attributed to Gathering and Boosting Segment | 21.6% | 38.3% | 36.8% | |
| Scope 2 GHG Emissions (MT CO2e) | 5,294 | 35,373 | 83,460 | |
| Scopes 1 and 2 Combined GHG Intensity (#) | 2.03 | 1.85 | 1.89 | |
| Scope 1 Methane Emissions (MT CH4) | 13,870 | 5,070 | 4,414 | |
| Scope 1 Methane Intensity (#) | 0.04 | 0.01 | 0.01 | |
| Percent of Scope 1 Methane Emissions Attributed to Gathering and Boosting Segment | 8.6% | 45.2% | 45.4% | |
| Flaring | Gross Annual Volume of Flared Gas (Mcf)[7] | 0 | 0 | 0 |
| Percentage of Gas Flared per Mcf of Gas Produced | 0% | 0% | 0% | |
| Volume of Gas Flared per Barrel of Oil Equivalent produced | 0 | 0 | 0 | |
| Spills | Produced Liquid Spilled (Bbl) | 900 | 717 | 866 |
| Total Produced Liquid (MBbl) | 23,063 | 26,399 | 27,646 | |
| Spill Intensity (#) | 0.04 | 0.03 | 0.03 | |
| Water Use | Freshwater Consumed (Bbl) | 36,685,100 | 42,649,071 | 45,487,045 |
| Freshwater Intensity (#) | 0.11 | 0.11 | 0.12 | |
| Recycled Water (Bbl)[8] | 19,645,315 | 31,279,373 | 35,238,755 | |
| Total Water Consumed (Bbl)[9] | 56,330,415 | 73,928,444 | 80,725,800 | |
| Water Recycle Rate (%) | 34.9% | 42.3% | 43.7% | |
| Does your company use WRI Aqueduct, GEMI, Water Risk Filter, Water Risk Monetizer, or other comparable tool or methodology to determine the water stressed areas in your portfolio? | Yes | Yes | Yes | |
| Safety | Employee OSHA Recordable Cases | 6 | 9 | 7 |
| Annual Employee Workhours | 1,471,840 | 1,575,944 | 2,519,637 | |
| Employee TRIR | 0.82 | 1.14 | 0.56 | |
| Contractor OSHA Recordable Cases | 22 | 24 | 25 | |
| Annual Contractor Workhours | 5,338,964 | 6,085,081 | 7,310,602 | |
| Contractor TRIR | 0.82 | 0.79 | 0.68 | |
| Combined Employee and Contractor OSHA Recordable Cases | 28 | 33 | 32 | |
| Annual Combined Employee and Contractor Workhours | 6,810,804 | 7,661,024 | 9,830,240 | |
| Employee and Contractor Combined TRIR | 0.82 | 0.86 | 0.65 |
[1] All data is year-ended December 31, respective to the year.
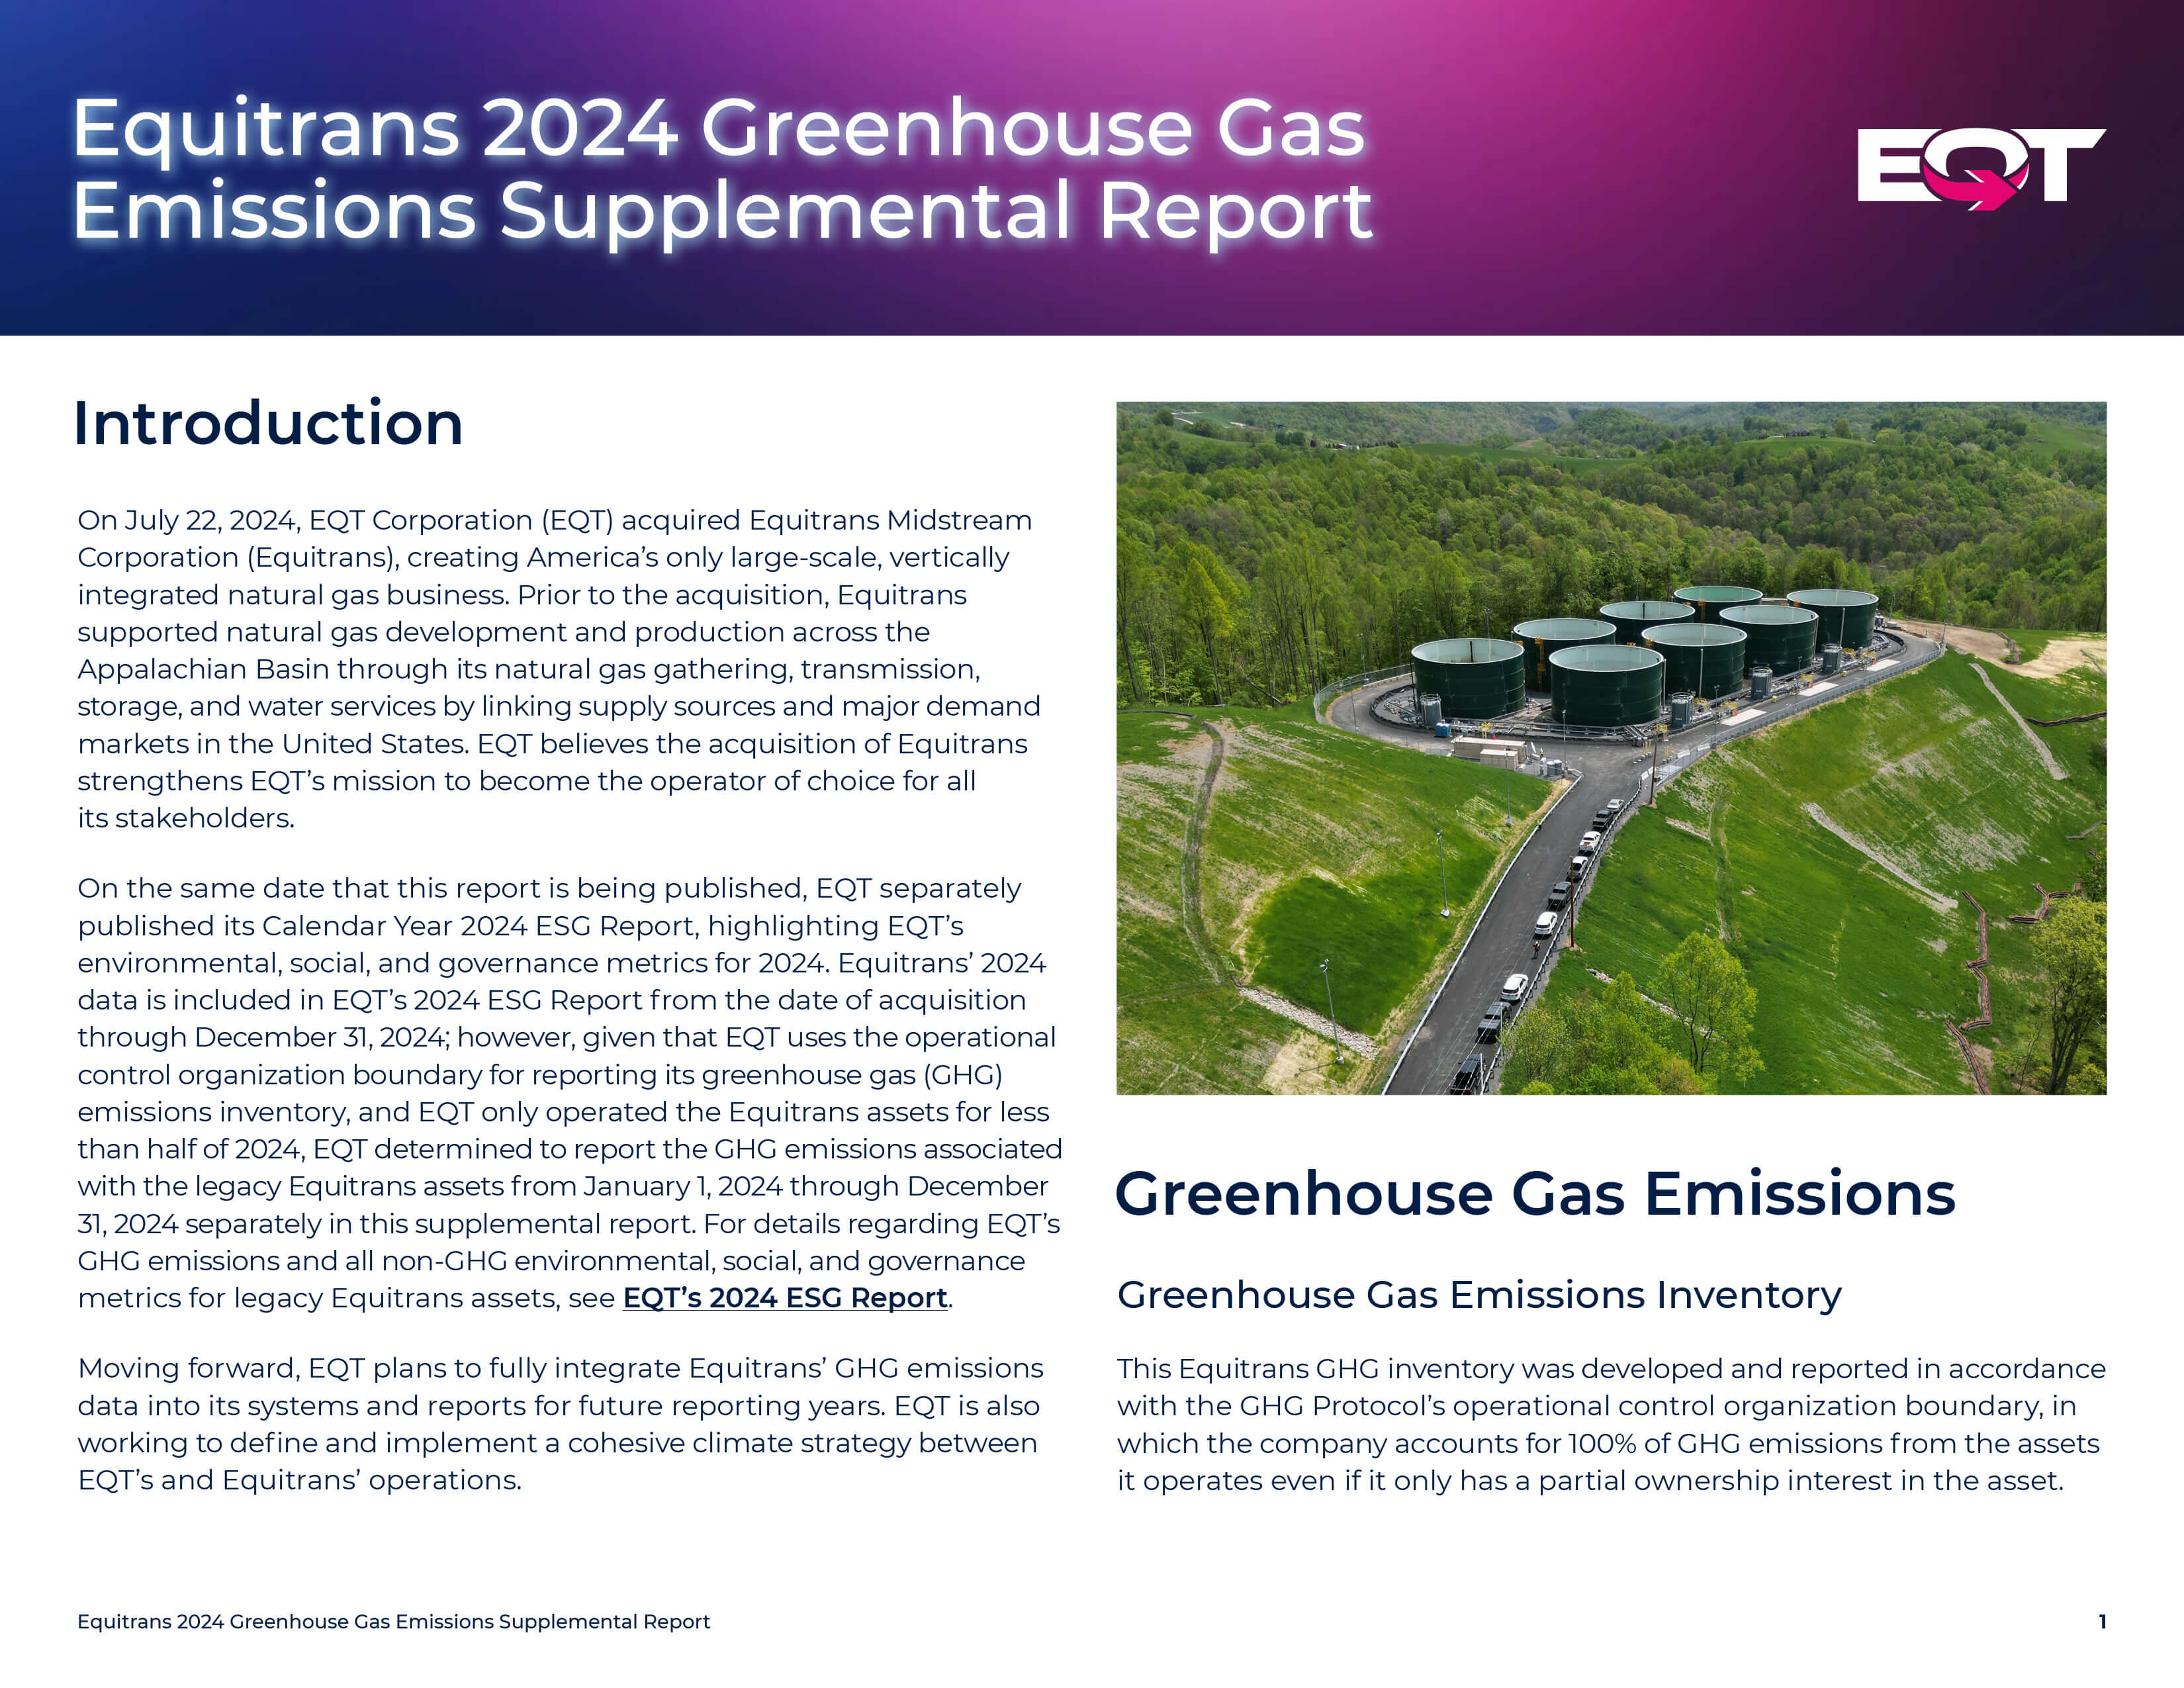
[2] In July 2021, we acquired strategic assets located in the Appalachian Basin from Alta Resources Development, LLC (the Alta Assets). Additionally, in August 2023, we acquired THQ Appalachia I Midco, LLC and THQ-XcL Holdings I Midco, LLC (XcL Midstream), collectively known as the Tug-XcL Assets. All of the data included in the table above includes data from the Alta Assets. Data from the Tug-XcL Assets is included within the 2023-2024 data columns in the table above. In July 2024, we acquired Equitrans Midstream Corporation (the Equitrans Assets). Data from the Equitrans Assets is included in the 2024 data column, except GHG emissions.
[3] We are subject to the methodologies for reporting GHG emissions under Subpart W (Petroleum and Natural Gas Systems) of the EPA’s Greenhouse Gas Reporting Program. We calculate our Scope 1 GHG emissions using EPA calculation guidelines under 40 Code of Federal Regulations Part 98. Notably, there are certain sources of emissions which are not reported to the EPA, either because the amount of emissions does not satisfy the minimum reporting threshold or because the EPA does not require emissions from the particular source to be reported. Pursuant to the AXPC’s ESG Metrics Framework guidance, the Scope 1 GHG emissions disclosed in this table include only our EPA Subpart W emissions for the onshore production and gathering and boosting segments, and thus, in some cases there may be additional sources of Scope 1 GHG emissions that are not reflected because they are not required to be reported to the EPA under Subpart W.
[4] The EPA recently revised 40 CFR 98 to update the global warming potentials (GWPs) used to convert emissions to a CO2e basis to align with the GWPs that were established in the IPCC Fifth Assessment Report (AR5 - 100 year). The 2024 emissions were calculated using these revised GWPs. The emissions for prior years were calculated using the GWPs that were effective at the time these values were calculated, which were established in the IPCC Fourth Assessment Report (AR4 - 100 year). As such, the 2022 and 2023 emissions values are not directly comparable to the 2024 emissions values.
[5] GHG emissions generated by the Equitrans Assets are not included in the 2024 totals. See the Equitrans Greenhouse Gas Emissions Supplemental Report for the emissions details for these assets.
[6] The Scope 1 GHG emissions values are gross emissions before offsets are applied.
[7] Per AXPC guidance, this metric applies to the flaring of wellhead gas from the primary separator at operated assets. It does not include combustion of low-pressure gas volumes from crude oil/condensate and produced water storage vessels or other low-pressure separators for the purpose of controlling emissions. It does not include flaring from drilling and/or well completions.
[8] Per AXPC guidance, recycled water includes water that was produced in the oil field and reused in the oil field (whether or not it was purchased from a 3rd party). These recycling values do not match the recycling values disclosed in the ESG Report, as the report only includes water EQT generated that was recycled and does not include water received from third parties.
[9] Per AXPC guidance, total water consumed includes all water sources used including fresh water, recycled water, etc.
